


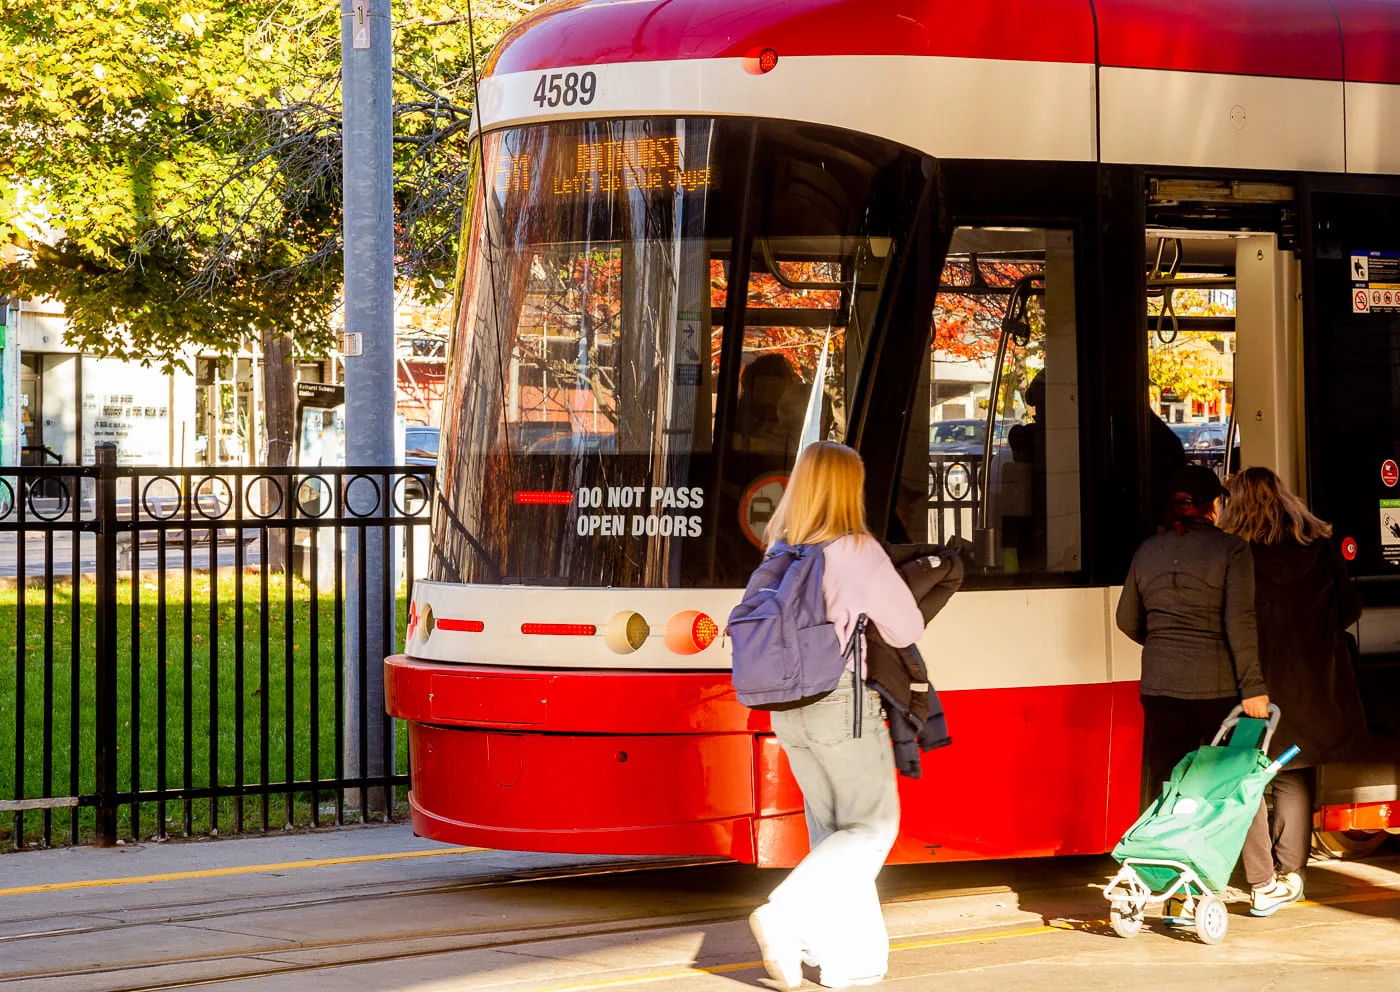
Toronto should keep its protected bike lanes. A street belongs to everyone who uses it, including people who cycle, walk, take the bus, drive or need an accessible pickup. A driver's delay matters. So does another person's safe trip home.
Wanting a safety feature removed simply because it inconveniences your own journey is selfish. It turns a shared city into a contest in which someone else's risk counts for less than your time. That is a social problem as much as a transport argument.
Selfishness can spread like a disease when we reward the loudest demand for personal convenience. That's a metaphor for a habit, not a medical claim. If each of us treats our own trip as the only trip that matters, we lose the basic idea of a community.
Our conclusion is clear: keep the bike lanes and fix the parts that work badly. Protect bus priority where it moves passengers more reliably. Improve signals, loading and accessible stops. Toronto needs a street system that serves more people safely, not a promise that every driver will avoid waiting.
Bike lanes and bus lanes solve different problems
| Type | What it is meant to do | What can improve | What can become harder |
|---|---|---|---|
| A protected bike lane | Separate cycling from general traffic | Route continuity and cycling comfort | Loading, turning and curb access if poorly designed |
| A bus-priority lane | Keep buses from being delayed by general traffic | Bus speed and reliability | General traffic space and some parking arrangements |
| A general traffic lane | Carry mixed motor traffic | Local vehicle capacity | It can fill again or feed an unchanged bottleneck |
| A loading area | Provide space for deliveries or pickup | Reduce blocked lanes | It uses curb space that cannot serve every purpose at once |
Counting empty pavement in one photo doesn't measure how a lane works through the day.
What the Bloor pilot actually found
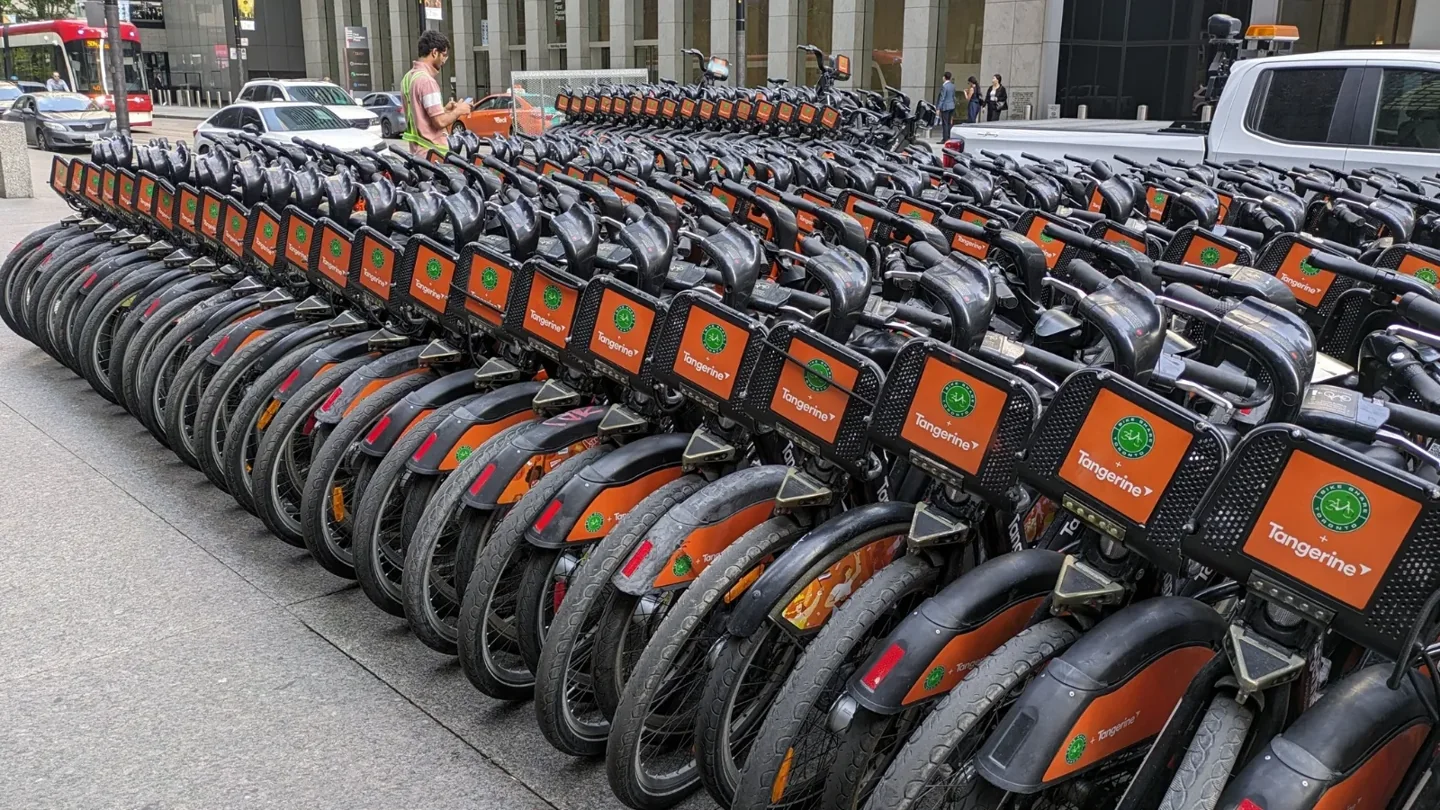
The City's Bloor Street pilot summary reports a 56% increase in cycling and a 44% decrease in observed conflicts after installation.
A conflict is not the same thing as a collision. Don't use that figure as a claim that crashes fell by 44%.
The page also reports motor-traffic delays and says signal changes helped reduce them. That is important: the project had costs as well as benefits.
The study concerned a particular stretch of Bloor, from Shaw to Avenue Road, and a particular period. It isn't a direct measurement of every later Bloor extension or every street in 2026.
Keep the protected route and fix the junctions that create delay. A successful pilot doesn't make every design perfect. The useful response is repair, not a demand that cyclists lose protection.
Dufferin bus lanes: measure the bus trip as well as the car trip
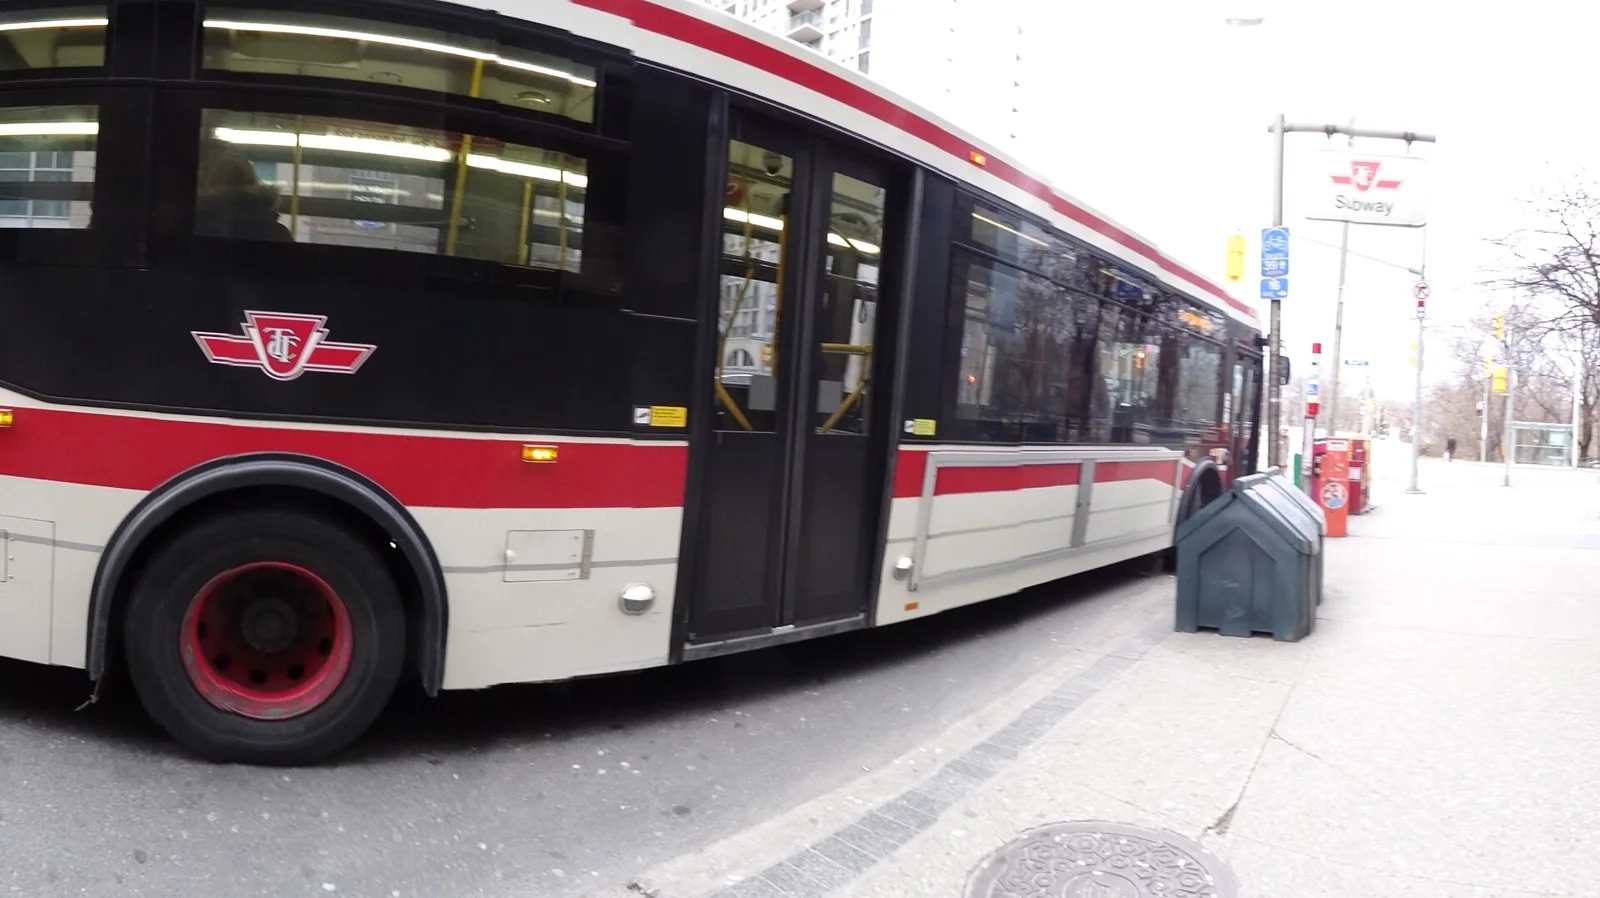

The City's RapidTO Dufferin page says installation is complete from Dufferin Station, north of Bloor, to King Street West. Its May 2026 update says monitoring is underway.
The published design includes one bus-priority lane and one general lane in each direction. It also changes parking and loading arrangements.
Those are real changes for drivers and nearby residents. The project must be assessed for traffic infiltration, turning, deliveries and access, not only the bus's travel time.
But the bus's passengers also count. A lane can look lightly used between buses while still moving many people when a bus arrives.
We haven't found a final evaluation that justifies a universal claim of success or failure for this new corridor. Confidence in exact post-installation time savings is low until the current measured results are published.
Choose the monitoring data when it is available. Don't turn the project's intended benefit into a proven outcome.
What the Dufferin capacity numbers mean
The City's April 2025 Dufferin presentation estimated that a private-vehicle lane could move 700 to 900 people an hour. It gave a priority bus lane a range of 1,100 to 1,900 people an hour.
Those figures use assumptions: 1.3 people per car and 77 people per bus, with buses spaced 2.5 to four minutes apart. They are a planning capacity comparison. They are not measured proof that every Dufferin bus is full or arrives on time after the May 2026 installation.
That distinction is the heart of the debate. A bus lane can look emptier between vehicles while carrying more people over an hour. But an unreliable bus service can fail to deliver the planned benefit. Lanes and service management both matter.
The current project page says monitoring includes road safety, traffic on nearby streets and travel times. Ask for those results, alongside bus reliability and passenger counts.
Our test is simple: did people's journeys improve, and what happened to injuries, deliveries and neighbouring streets? Choose that evidence over a photo of an empty lane or a queue of cars. Neither image measures a whole day.
The before-and-after numbers: the delays should be visible too
Bloor's pilot changed both travel times and road use
The City's 2017 performance table compares June 2016 with June 2017. It includes a preliminary October 2016 check too. This is historical evidence for the original pilot, not a count of today's whole Bloor corridor.
| Measure | Before, June 2016 | After, June 2017 | Change |
|---|---|---|---|
| Bloor daily cyclists, both directions | 3,309 | 4,925 | Up 49% |
| Bloor daily motor vehicles, both directions | 24,322 | 20,434 | Down 16% |
| Bloor morning peak eastbound vehicle trip | 10:01 | 12:01 | Two minutes longer |
| Bloor evening peak westbound vehicle trip | 11:14 | 15:29 | Four minutes, 15 seconds longer |
| On-street parking spaces in the evaluation | 303 | 167 | 136 fewer |
| Dupont daily motor vehicles | 20,491 | 21,958 | Up 7% |
This gives the removal argument a real point: some drivers lost time, particularly in the evening direction. Saying the lane had benefits does not make that delay disappear.
It also gives the keeping argument a real point: more people used the cycling route, while Bloor's motor volume fell. The adjacent Dupont count rose, so it would be wrong to say none of the traffic moved elsewhere.
The preliminary westbound evening time was 19:39. By June 2017 it had improved to 15:29, but was still above the original 11:14. “Signal adjustments helped” and “drivers still experienced delay” can both be true.
The 49% count change in this attachment is not the same figure as the 56% cycling increase on the City's broader summary page. Keep the measure and source attached to the number. Mixing them would create a false precision.
What the table cannot prove
A before-and-after study has a real baseline, but other conditions can change too. Weather, nearby construction, route changes and travel choices affect counts. A June weekday evaluation does not describe every winter evening.
The fall in Bloor traffic also needs a network question. Some trips shifted to nearby streets. Some may have changed mode, route or time. The table alone cannot assign every missing car to a cause.
Our judgement is that this evidence supports a targeted discussion of delay and diversion, while also showing a cycling benefit. It does not support the claim that the pilot was cost-free. It also does not show that removing every Toronto lane will improve whole journeys.
Eglinton East gives us a separate bus-lane test
The RapidTO Eglinton East project covers 8.5 kilometres and began in late 2020. It combines former HOV space on Eglinton with curb lanes on Kingston and Morningside. It is not the same design or corridor as the new Dufferin project.
The January 2022 to March 2023 dashboard reports bus travel-time savings up to about two minutes in the morning against the week before launch, and up to about three minutes in the evening. The larger savings against October 2019 include the pandemic-era change in traffic.
The dashboard reports whole-corridor car time increases below about one minute in the morning and up to about one minute in the evening. Some Morningside segments had larger changes. An average across the full corridor can therefore hide a harder local trip.
These are historical monitored results, not measured October 2026 commute times. The dashboard explicitly discusses pandemic conditions. Don't give all the difference to the red paint.
The City reports roughly $4 million in annual operating savings, a $6.3 million one-time capital cost and $2.5 million in one-time capital savings for the project. Those are the operator's reported amounts, not an independent audit in this article. The service and budget results belong beside the car-delay results.
Which changes should Toronto test before removal?
| Problem | First useful test | Evidence that would change the recommendation |
|---|---|---|
| One turning queue blocks a lane | Signal timing and turn arrangements | Similar-day whole-trip times and queue length |
| Deliveries repeatedly block the route | Loading location, hours and enforcement | Delivery access without transferring blockage to another lane |
| Buses still bunch in a priority lane | Dispatch, headway and intersection delay | Passenger wait times and bunching, not only vehicle speed |
| Cars spill into residential streets | Nearby counts and local traffic management | A sustained comparable increase, rather than one anecdote |
| A bike route ends in a difficult merge | Junction and network connection design | A safer usable route, not a disconnected painted segment |
Each problem deserves its own fix. Removing a lane can help a local queue while losing a bus advantage or a protected cycling connection. Keeping a lane can preserve that benefit while leaving a bad loading design unresolved.
Ask for results per traveller and per hour, not only per vehicle. Then ask who bears the remaining delay or access problem. That is the honest way to decide whether a specific lane should stay, change or go.
Four locations show why the design matters
Look at the actual street before borrowing a conclusion from another neighbourhood.
| Location | What you're comparing | What a fair test needs |
|---|---|---|
| King Street, Bathurst to Jarvis | Streetcars get priority over through-driving | Streetcar trip time, waits, enforcement and traffic on nearby streets |
| King and Spadina | A busy transfer intersection inside that corridor | Intersection delay and blocked vehicles, not just the number of lanes |
| King and Yonge | Transit movement in the office and entertainment core | Peak and evening observations, with the same comparison period |
| Dufferin, Bloor to King | The bus-priority corridor discussed above | Bus passengers' time as well as drivers' time |
The City's King Street page confirms the Bathurst-to-Jarvis limits. The pilot started November 12, 2017, and became permanent in April 2019. This is a different design from a bike lane or a curbside bus lane.
King and Spadina, King and Yonge, and the Jarvis end are useful places to understand the layout. They are not a substitute for a citywide traffic study. A queue during one visit cannot show what would happen after removing the corridor.
Our judgement: compare like with like. Use King to examine transit priority and intersection rules. Use the Bloor study to examine a bike-lane change. Use the Dufferin data to examine a bus-lane change. Combining them into one “lane removal” claim hides the choice Toronto is actually making.
The strongest case for removal
The serious argument is local and measurable. A lost lane can make a particular queue longer. A difficult turn can block vehicles behind it. Loading can become awkward, and diverted cars can reach nearby residential streets.
Those are valid problems to investigate. Drivers do not need to deny cycling's benefits to point them out.
The evidence needs to show where, when and how much. Compare similar weekdays, weather and construction conditions. Measure the whole trip rather than one queue.
Then test alternatives. A signal adjustment, a better loading zone or a turning change can sometimes address the problem without removing the protected route.
Choose removal only after the comparison shows it is the better fix for that specific problem. “I was stuck there” identifies a concern; it doesn't settle the design.
The strongest case for keeping the lanes

A connected bike route lets some trips be made without adding another car to the street. A reliable bus lane makes public transport more useful for the people who need it.
The important word is connected. A short protected segment that ends in a difficult merge may not deliver the same benefit as a usable route.
Safety matters too. A road plan should not count only the minutes of the people in cars. It also has to consider people walking, cycling, boarding buses or using mobility aids.
The weakness in the pro-lane argument is pretending every change is painless. Lost parking, difficult deliveries and bad intersections need a response.
Keep useful lanes and improve the parts that fail. Don't treat criticism of one design as hostility to the whole mode of travel.
Parking and deliveries deserve their own plan
A travel lane, a parking space and a loading zone aren't interchangeable. The street has several jobs.
Removing all curbside access without a workable alternative can hurt people collecting heavy goods, drivers making deliveries and residents who need close pickup.
Likewise, tolerating parked or loading vehicles in an active lane can destroy the capacity the plan was meant to preserve.
Compare the actual loading windows and locations. Check whether an accessible drop-off is usable, not merely drawn on a map.
Choose a design that works for these trips. Skip the idea that every curb request can be solved by telling someone to cycle.
Not every commuter has a reasonable transit alternative
A convenient subway trip downtown is different from a cross-city journey with several connections. Shift times, disability, caregiving and tools or equipment can change the choice.
That is why “drivers should just take transit” is too broad. Compare the routes available to the person making the trip.
At the same time, a difficult trip for one driver doesn't establish that all buses should lose priority. Improvements need to make alternatives more usable, not just moralize about choices.
For a transport plan, check frequency, transfers and reliability. A theoretical route on a map is not the same as a practical daily commute.
The provincial removal programme is a separate current fact
Ontario's September 1, 2026 announcement says it issued a request for proposals following a Court of Appeal ruling for work on several Toronto corridors.
That announcement establishes a government action and its stated rationale. It does not prove that the work will produce the claimed traffic benefit.
It also isn't a reason to assume every listed segment has already changed. Check current construction and route notices before travelling.
Separate the policy decision, the legal status and the transport outcome. They are three different questions.
What remains unconfirmed about the removal timeline
Cycle Toronto’s September 10 update describes the August appeal ruling and the province’s proposed work. It estimates that part of Bloor between Islington and Royal York could be targeted in the 2026 construction season. That is the advocacy group’s interpretation of the announced process, not proof that the lanes have already been removed.
The same update describes a wider 19-kilometre design process on Bloor, Yonge and University, with later work expected in 2027. As checked October 12, we have not independently established that forecast as a completed construction schedule. A court decision, a tender and finished road work are different stages.
Our editorial view does not change with that distinction: keep safe cycle routes. But readers should use current street notices for a journey and current official announcements for the work’s status.
Our conclusion: keep the bike lanes and act like a community
Toronto should keep protected bike lanes. The Bloor evidence shows why a safety measure deserves more than an angry glance from a car window. The recorded traffic delays deserve fixes too. Keeping the lanes means taking both parts of the evidence seriously.
The selfish argument is that another person's protection is expendable whenever our own trip becomes less convenient. Follow that rule across a city and almost any shared service becomes a target. A bus lane, a school crossing or an accessible loading space will inconvenience someone at some point.
A community works because we accept that other people have needs we don't share. Today you may drive. Tomorrow a family member may cycle, need Wheel-Trans or take a bus because they can't afford a car. Public streets must work beyond one person's current routine.
Our test is practical: safer crossings, connected cycle routes, reliable buses, workable deliveries and proper accessible pickup. Publish the results and repair the weak points. Keep the lanes. Stop treating their removal as the easy answer to a much larger traffic problem.
Frequently asked questions
Do bike lanes always make traffic worse?
No universal answer is supported by the evidence here. Effects vary by corridor, intersections, design and travel choices. Toronto's Bloor pilot recorded benefits and delays.
Would removing a lane make cars faster?
It can change local capacity, but the next bottleneck and wider traffic response still matter. Measure the whole journey before promising a saving.
Are bike lanes and bus lanes the same policy?
No. Bike lanes provide a cycling route, while bus lanes prioritize bus movement. Each needs its own evaluation.
Does a 44% drop in conflicts mean 44% fewer crashes?
No. Conflicts and collisions are different measures. Read the study's definitions before using a figure.
Have Dufferin's bus lanes been proven successful?
The City's current page says monitoring is underway. We haven't verified a final result that supports a blanket success or failure claim.
Is every driver able to switch to transit?
No. Route quality, work times, access needs and the trip's purpose can affect that choice. A fair plan must address those practical limits.
For other travel choices, see our commuter guide and neighbourhood guides. Ask for a measured fix to a specific problem. That is more useful than treating removal or installation as a cure for the whole city.
Related Toronto guides: How to Use Bike Share Toronto Without Surprise Charges, 19 Places to See Fall Colours in Toronto by TTC: Easy Walks, Ravines and Honest Picks.